See what your P&L doesn't show.
Your MT5 history already contains the evidence about behaviour, execution and risk. The X-Ray turns it into facts you can read.
FREE in the free X-Ray · COMPLETE in the complete X-Ray: Pro or the €12 challenge post-mortem (payments not open yet) · COMING not built yet
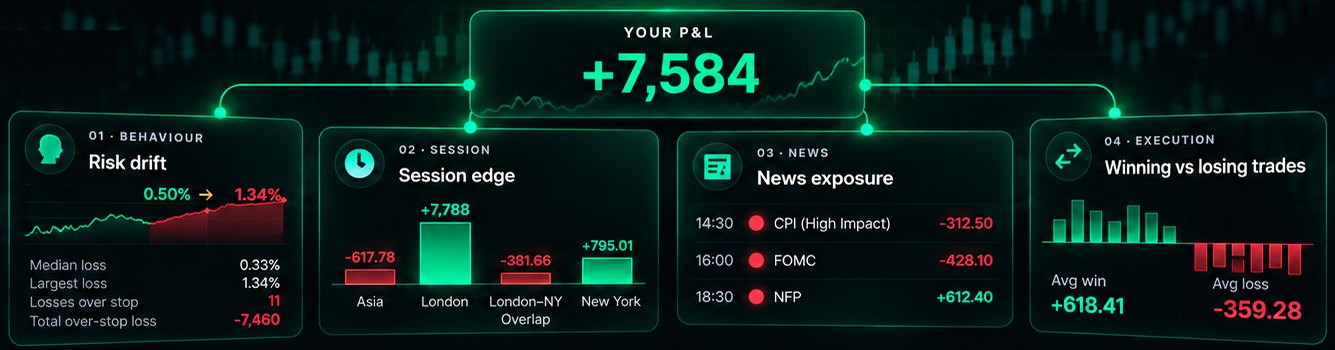
Risk drift
You believe you risk 0.50%. Enter your target and the X-Ray shows your real median loss as a share of the balance, and how many losses went above it.
Session edge
Asia, London, the London–New York overlap and New York side by side: trades, win rate, profit factor and net result of each.
News exposure
How your trades behaved around high-impact releases, using the news archive Tickerlane already records with timestamps and measured price reactions.
Winning vs losing trades
How long you hold winners and losers, results in R against your stop, losses that went beyond it, and what happens when you re-enter right after a loss.
Your trading has a fingerprint.
Not another dashboard full of numbers: a clear picture of where your results come from. Here is what works today and what comes next.
Trader X-Ray
Recurring behaviours, re-entries after a loss, size increases, busy days, stops moved or missing. The 3 biggest are free; every pattern is in the complete X-Ray.
Trading DNA
Your results by symbol, session, weekday, hour and holding time.
Edge check
Is your average result distinguishable from zero, or could it be chance? A statistical range on your own trades.
Risk, prop & discipline
Free: drawdown, prop-limit verdict, clean days and what rule-breaking trades added up to. Complete: loss per trade as % of balance, stops and R, and your rules one by one.
Market context
Your trades next to volatility and relevant news windows.
AI explanations
Your historical patterns explained in plain language, never generic trading tips.
FREE and COMPLETE items are measured on your report in a few seconds, in your browser.
Analyze my trades →